Tsunami Decimates Thailand

Thailand Statistics

Home
Human Enviornmental Impact
Deathwatch
Water Wheels, Water Wheels, Water Wheels!
Thailand Statistics
Work Cited Page
Thailand pictures
Hope You Enjoyed!!!!!

          My graphs explain how the tsuanmi affected the way Thailand now lives there everyday life. My first graph is a comparison between Indonesia and Thailand's tsunami deaths. My second graph is the percentage of safe drinking water a country has every year. My third and final  
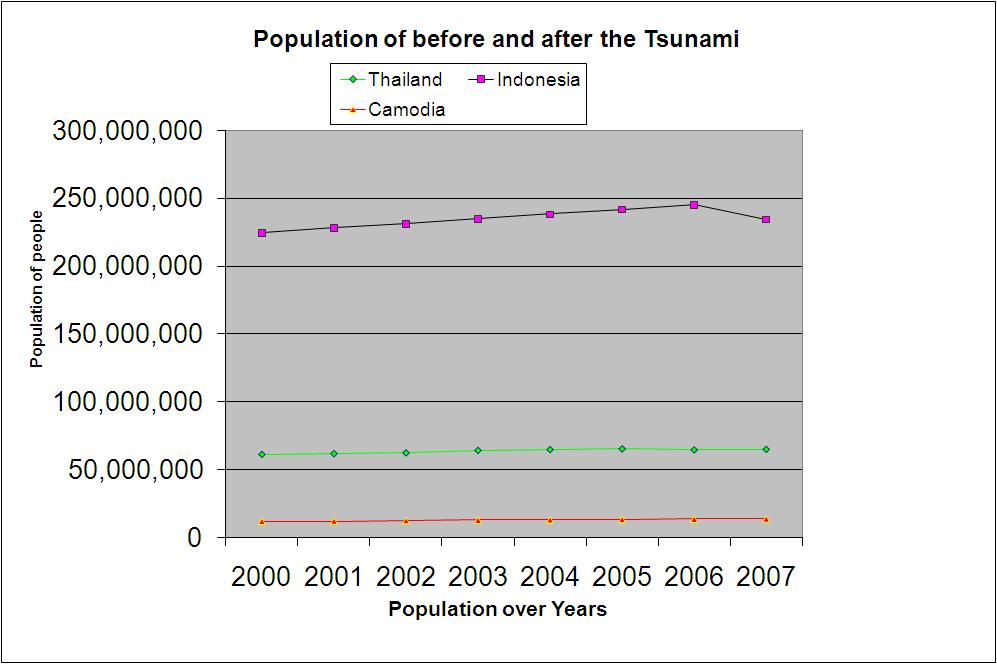
graph is how the population increased or decreased over the years before and after the tsunami.
 

image002.gif
Indonesia and thailand graph

Enter second column content here

image001.gif
Safe Drinking Water by Country

grapds111.jpg
Population before and after the Tsunmai.

Enter third column content here

All rights reserved. 2007-2008